Reading stats
Tome's stats are built from real session data — every minute logged by the web reader and every session the TomeSync KOReader plugin reports. No estimates from page counts, no fudge factors, no guessing. If a chart is empty, it's because the data isn't there yet.
The page itself is a dashboard: every chart on it is a tile on a drag-and-resize grid, and the three boards it ships with — Overview, Habits, and Library — are just the defaults.
Make it yours
Hit Edit and the grid opens up: drag tiles by their header, resize them by the corner handle, remove or duplicate them, and undo a removal straight from the toast. Add tile opens a gallery of 50 widgets with live previews — everything documented below, plus extras like a paginated session log, reading by weekday, a time-of-day split, time by format, recently finished, a monthly streak calendar, and the word-count tiles (words read, reading speed, book length).
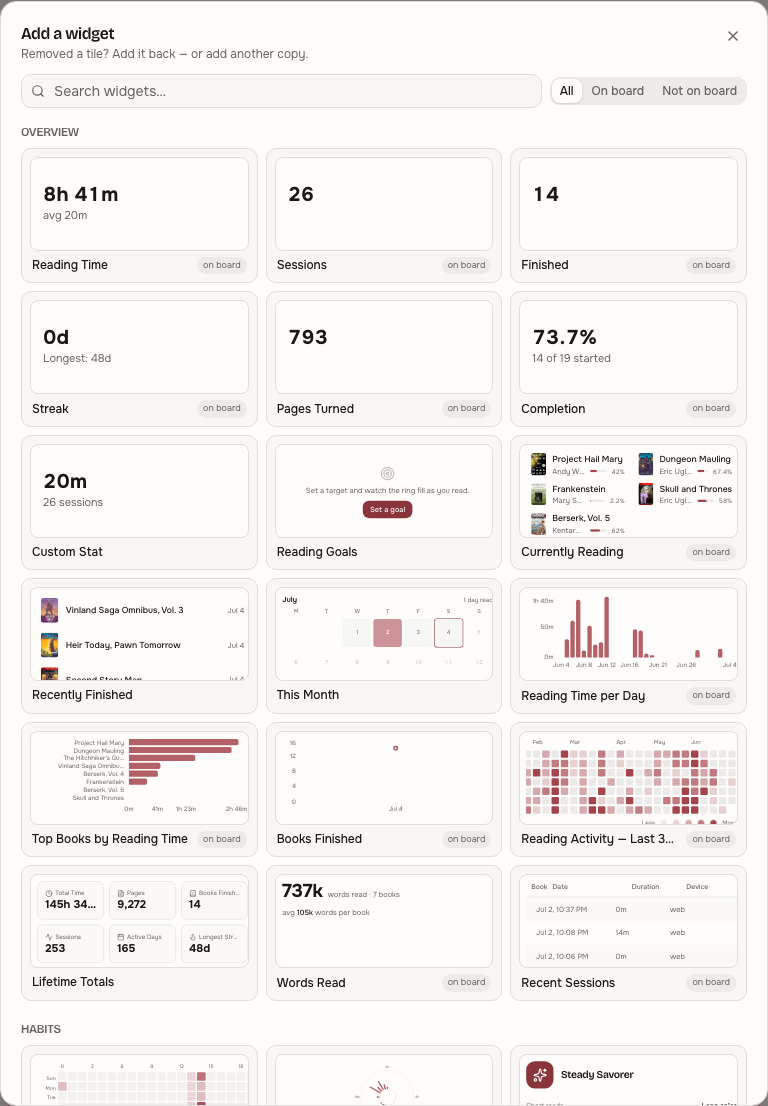
Tiles are individually configurable where it makes sense: chart tiles switch between bar, line, and area; time-series tiles can follow the page's range picker or pin their own window; the Custom Stat tile counts whichever metric you pick; Series Spotlight focuses on one series of your choice.
Tabs are boards. Create new ones — empty, duplicated from the current board, or from the built-in defaults — rename them with a double-click, and delete the ones you don't want (undo included). Layouts are saved per-user on the server, so your boards follow you to every device; a board can also be exported as JSON to share and imported on another account, and the camera button saves any board as a PNG image.
Where the data comes from
Two writers, one table. The web reader and the
TomeSync plugin both POST to reading_sessions: start
time, end time, pages turned, device. The stats endpoints aggregate from there. The
UserBookStatus table provides finished-book counts (status = "read")
and the TomeSyncPosition table provides current-progress percentages.
Overview board
The "where am I right now?" board. Designed to be glanceable. Like every section below, each chart here is a tile — what follows describes the default layout.
Totals + streak
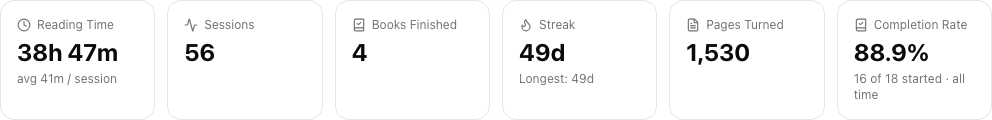
Six counters across the top, scoped to the period selector (default 30d, options 7d / 30d /
90d / 365d / all). Sum of duration_seconds, count of session rows, finished books,
current streak, pages turned, completion rate. Average session length is shown under
Reading Time.
Streak is in local-with-rollover days, with a one-day grace: if you haven't read yet today, the streak still shows yesterday's value instead of dropping to zero. Once midnight (plus rollover) passes without a session, the streak breaks.
Currently reading
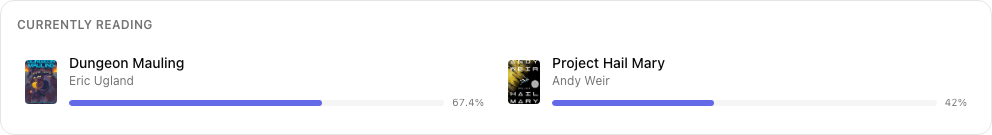
Books with UserBookStatus.status = "reading", ordered by most-recently-read.
Progress comes from TomeSyncPosition.percentage when KOReader has reported in,
else UserBookStatus.progress_pct from the web reader.
Reading time per day
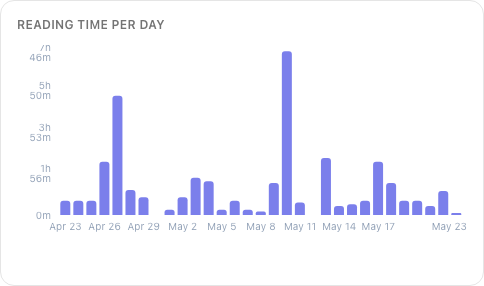
One bar per day in the selected period. Tallest spike is your biggest session day. Useful to spot binges (single tall bar) vs steady consistency (many short bars).
Top books
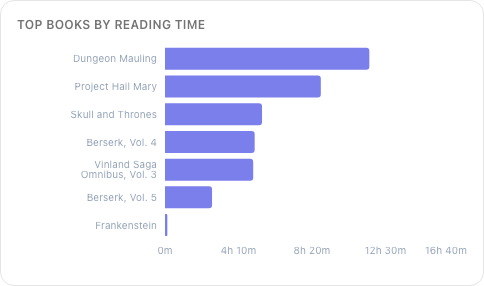
Top 10 books by total reading time in the period. Joins reading_sessions against
books and groups by book_id. The big numbers usually surface a book you've been
chewing on for weeks.
365-day activity grid
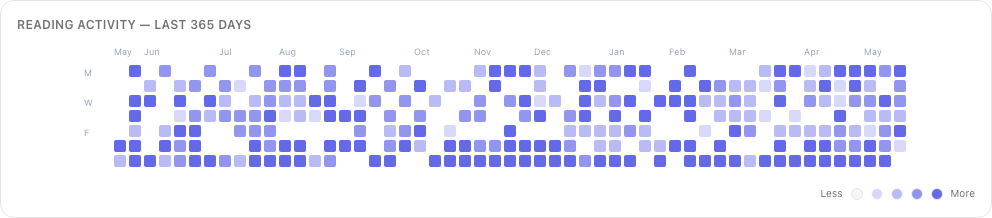
GitHub-style annual heatmap of daily reading minutes. Cells go from empty (no session) to full accent (1h+ in a day). Useful to spot patterns — vacation blocks, work-week droughts, weekend regulars.
Habits board
The "when and how do I read?" board.
Reading DNA
A tile version of the Home page's Reading DNA card: your reading personality as an archetype plus the trait spectrums that produced it (short reads vs. long epics, focused vs. eclectic, early bird vs. night owl, …). Add it from Add tile under Habits.
Hour × day-of-week heatmap
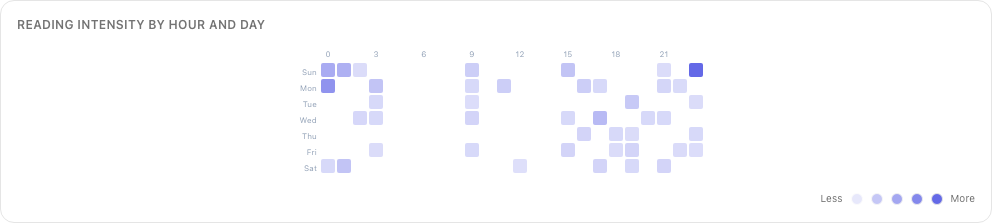
A 7×24 grid. Each cell is "minutes read in this hour of this weekday, summed across the selected period." The colour scale is per-user: the darkest cell is your peak, everything else is relative to it.
The interpretation: find your reading windows. If Monday 21:00 lights up but Monday 09:00 is blank, you read at night, not before work. If Saturday morning blooms after a few months of use, you read more on weekends than you thought. The point isn't the absolute numbers, it's the shape.
Session timeline
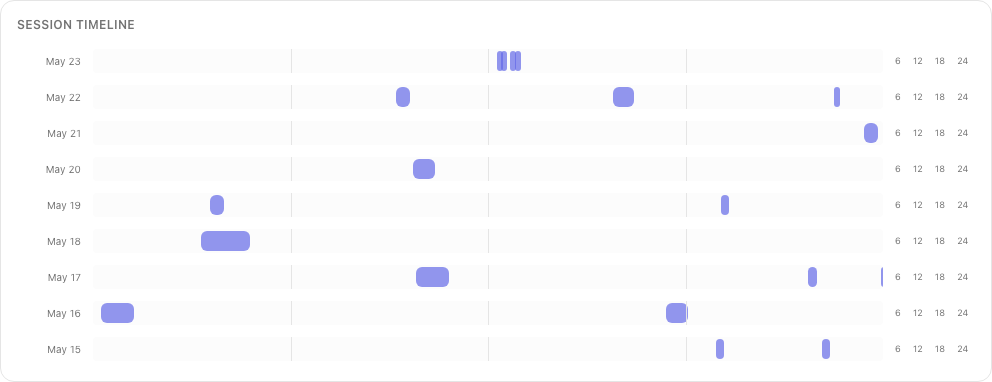
Recent sessions plotted as horizontal bars on a time axis — start time on the x-axis, duration as bar length, one row per date. Lets you see binge sessions (long bars) vs nibble sessions (short bars), and at a glance whether you read in one big block or many small ones.
Reading pace
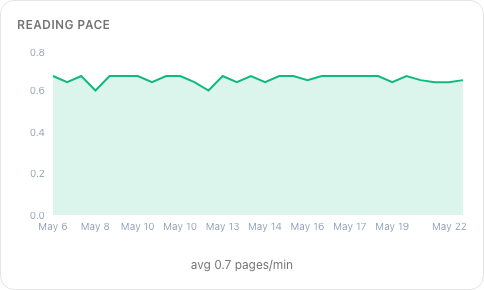
Pages per minute, computed per-session from sessions with
duration_seconds > 60 and pages_turned > 0.
Two things this catches: format effects (manga clocks 5+ ppm, dense literary fiction sometimes 1 ppm) and tiredness (your evening pace usually drops below your morning pace). Don't compare your number to anyone else's — pace is a fingerprint, not a benchmark.
Monthly comparison
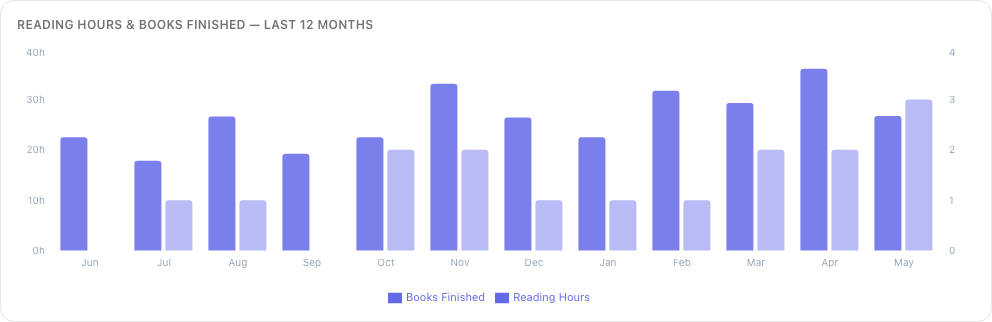
Reading hours + books finished by month, last 12 months. Smooths out the day-to-day noise — month-on-month is more legible than week-on-week.
Library board
The "what have I been reading?" board. Focused on books, not on time.
Series completion ladder
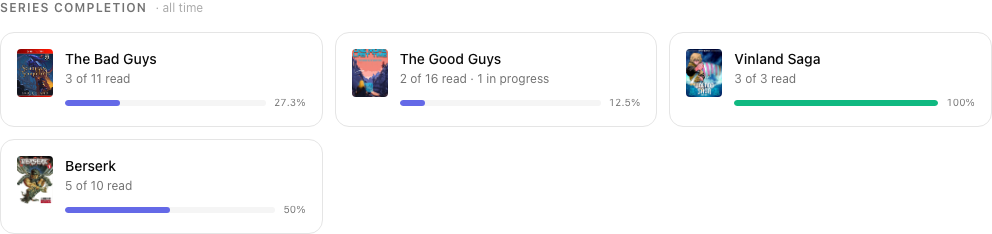
For every series you have at least one volume in, a card showing volumes you own vs volumes you've finished. Standalones are skipped — they're not a ladder.
Author affinity
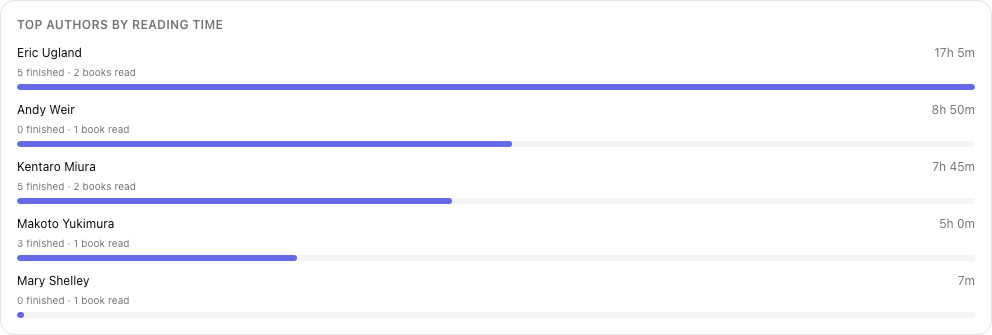
Authors ranked by total minutes spent in their books. Distinct from "most books read" — an author you've read three short novels by ranks lower than one whose 1500-page tome you've finished.
Completion by type
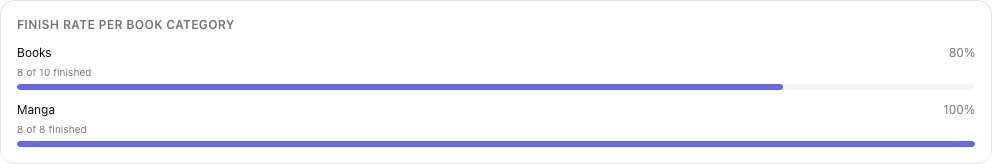
For each BookType (Novels, Manga, Comics, etc.) — total books started vs finished.
Quick way to see "I'm a manga reader who pretends to read novels" or vice versa.
Category breakdown
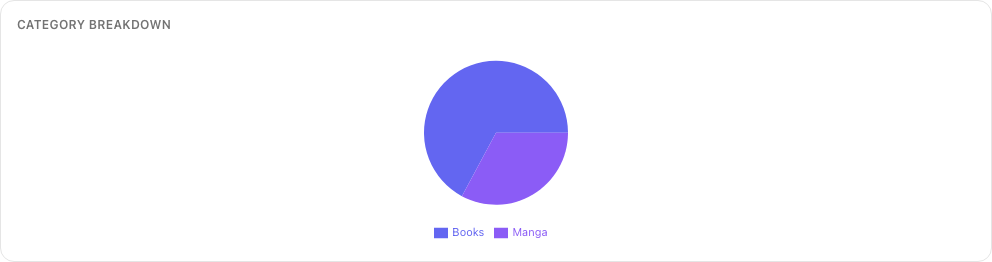
Reading time split by book type — pie chart format. Pairs with completion-by-type to show not just how much you finish but how much time you sink in each format.
Library growth
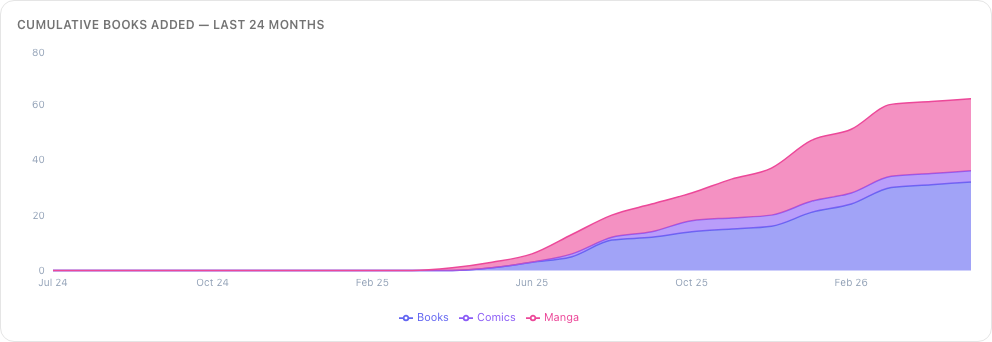
A cumulative line chart of books.added_at grouped by month and split by book
type. Not about reading — about hoarding. Goes up and to the right. Useful for noticing
acquisition sprees you'd otherwise forget about.
Word-count & page insights
Once Tome knows your books' word counts and has imported your KOReader reading history, a few tiles turn that into things you can't get from session timing alone. All are in the tile gallery.
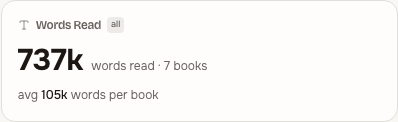
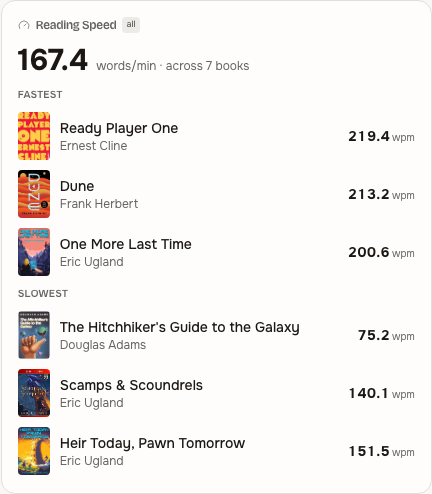
Words Read totals the words in every book you've finished, and Reading Speed is your true words-per-minute — word count divided by the time KOReader actually recorded — with your fastest and slowest books.
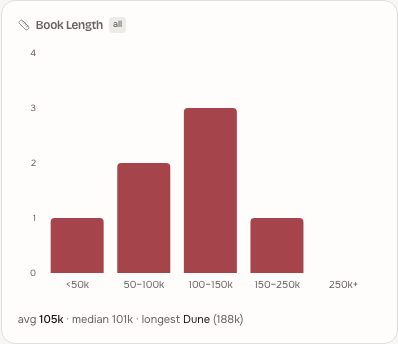
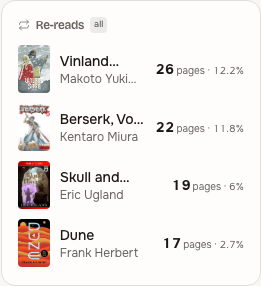
Book Length shows how long the books you finish tend to be, and Re-reads ranks the books whose pages you keep coming back to.
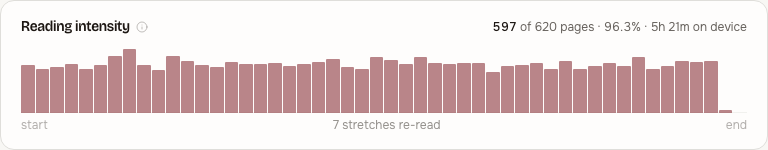
On each book's page, a Reading intensity strip shows where your time went across the book — page by page — with a real “X of Y pages” read and a note when you've re-read stretches.
The same per-book view carries a full reading log: every session with device, duration and pages, your day-by-day progress, and a per-book time total. You can log a session by hand (paper reading, or a device that wasn't synced) and export a book's log to CSV or JSON.
Charts that aren't here yet
Things explicitly considered and not built:
- Per-chapter pace within a book — too noisy for the current data shape; sessions cross chapters and chapter boundaries aren't tracked.
- Sleep-quality correlation — we have the data (late-night session detection) but no second data source to correlate against.
- Multi-user leaderboards — stats are per-user only by design. Tome isn't trying to gamify reading across a household.
API access
All the data behind these charts is reachable via the API. Useful for one-off scripts:
GET /api/stats?days=30&tz_offset=-120— the main bundle (everything on this page).GET /api/stats/completion-estimates— projected finish dates for in-progress books.GET /api/stats/sessions— paged session list, oldest first.DELETE /api/stats/sessions/{id}— delete a misfire.GET /api/stats/dashboard/PUT /api/stats/dashboard— your saved boards (opaque JSON, 256 KB cap). This is what syncs layouts across devices.
Authenticate with an API token or a JWT. Times are UTC in the
payload; bucketing happens server-side using the tz_offset you pass.